A burn up chart, or burnup chart, tracks progress towards a projects completion. In the simplest form of burn up chart there are two lines on the chart:
- A total work line (the project scope line)
- A work completed line
A burnup chart clearly shows both completed work and project scope. The project will be completed when the lines meet.
The vertical axis is amount of work, and is measured in units customized to your own project. Some common units are number of tasks, estimated hours or story points (in agile project management methodologies). The horizontal axis is time, usually measured in days.
At each day you can see the amount of work completed and the total amount of work. The distance between the two lines is thus the amount of work remaining. When the two lines meet, the project will be complete. This is a powerful measure of how close you are to completion of the project, similar to a burn down chart.
Regularly checking progress charts such as burn down charts or burn up charts is an important part of project management, agile, scrum or otherwise. These charts can allow you to instantly identify certain types of problems, such as scope creep or a deviation from the planned project path. These problems can then be discussed and corrective action can be taken at an early stage, rather than when it is too late, the hallmark of an effective project manager. Sharing these charts with customers can also build confidence and trust in both your management, and the progress of the project as a whole. Burn up charts are particularly commonly used in agile and scrum software development methodologies.
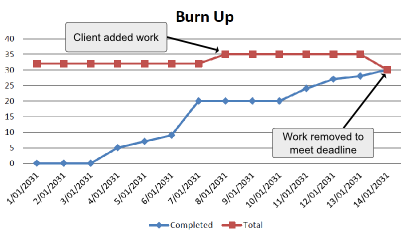
The advantage of a burn up chart over a burn down chart is the inclusion of the scope line. It clearly tracks when work has been added to or removed from the project. It also allows you to visualize a more realistic completion date for the project, by extending a trend line from the scope as well as the completion line. Where the two trend lines meet is the estimated time of completion.
The scope line allows you as a manager to easily spot where work is being added which will affect the completion date. Whether this work is being added by the client or the team, it is an important signal that the completion date may need to be moved in response. The scope line also tracks where work is being removed to meet a fixed deadline. Again this is important to know as it may impact the quality or functionality of the project, and is something that needs to be clearly discussed with the client and team.
Although a typical burn up chart only has two lines, other lines are sometimes included. Firstly an 'ideal' line may be included. This shows the completion necessary at each day to meet the deadline. You can then tell if the project is ahead of or behind schedule by whether it is above or below the ideal line, and the distance gives you an idea as to how far ahead or behind schedule it is. (The ideal line is usually based on the most recent available total scope for simplicity)
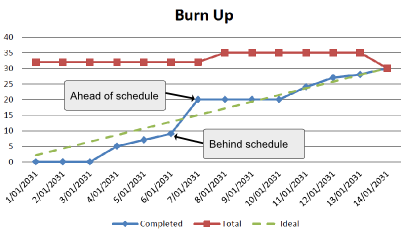
A burn up chart with an ideal line, showing where the project is ahead of and behind schedule.
Another line that is sometimes included is the required burn up line. This line shows how much work must be completed to meet the deadline, given the current scope.
Lastly, several burn up charts can be superimposed on top of one another. This is typically done for multi stage projects, such as release versions or development sprints in a software project. The scope lines are cumulatively stacked, whilst the completed line is either combined for all releases, or only for the next release and previously completed releases on any given day. The advantage of this layout is that it is clear when work is being shifted from one sprint to the next, as opposed to being added to the total project scope.
More advanced, but also more complicated to read than a burn up chart is a cumulative flow diagram.
Why use a burn up chart?
The goal of any chart is communication, a burn up chart clearly shows work completed and project scope. It is an effective tool for communicating to the project stakeholders and clients how the extra feature requests they are asking for will affect the deadline, and at the same time for reassuring them that good progress is being made. In a project where clients are adding a lot of work mid-project, a burn down chart will not be an accurate reflection of the project teams output, and could lead to performance questions from the client. A burn up chart can quickly make clients re-evaluate whether they really need that extra bell or whistle.
Unfortunately burn up charts are slightly more complex to interpret than burn down charst, so will often require some short explanation to people not familiar with them. However because of the extra information represented in a burn up chart, this explanation is usually more than worth the time, with the possible exception of large group situations.
How to create a burn up chart
A burn up chart can be created with many tools, from pen and paper to a spreadsheet program such as excel. The easiest way to create a burn up chart tracking a particular project is to use a project management tool with a good reporting system, such as Intelligent Reports for JIRA. Using reporting tools, burn up charts can be instantly or even automatically created using the data already tracked in your project management system. There is no excuse for not regularly reviewing progress charts such as burn up charts or burn down charts to check on the progress of your project, and take corrective action if any problems are discovered.
Intelligent Reports for JIRA can automatically insert burndown charts into professional reports created from almost any aspect of your JIRA data. Intelligent Reports is the easy customizable reporting solution for JIRA, giving you complete knowledge of what is happening in your engineering team. In minutes you could have customized progress reports, timesheet reports, SLA reports and more delivered automatically to your email inbox. So if you use JIRA, what are you waiting for? Get a free 30 day trial from the Atlassian Marketplace today.
This article is part of a series on project progress charts. Articles in this series: